Don’t use a variable named TMP in your scripts that call the dotnet CLI

For a long time now, I had a script where I was passing --no-build to a dotnet test command, because otherwise it got stuck in a very weird way. The tests never started running (in fact the build never finished), and if I hit Ctrl-C to stop it, even though it apparently stopped, something kept running in the background and printing warnings to my console, on top of whatever else I was doing.

build stuck warnings

I googled keywords from the warning and couldn’t find anything relevant. Today I had to deal with this script again and decided to fix it once and for all.

For context, this is a bash script that runs on Windows (with Git Bash) and basically does the following:
– Start a test environment with several containers using docker-compose.
– Figure out which ports were exposed on the host for some of those containers and export them as environment variables (so the project being run with dotnet test sees them).
– Run dotnet test to execute the tests in a project.
– Use docker-compose to remove the environment we spun up earlier.

So I started troubleshooting my dotnet test command.

It ran fine outside the script, and also by itself inside an .sh file. So I started adding all the other pieces of the script little by little, until I found the one that made dotnet test hang. It was a line pretty much identical to this:

TMP=$(docker port ${PROJECT_NAME}_myservice_1 80)

That’s (part of) how I get the port that was exposed for a particular container, but I refused to believe that executing docker port had anything to do with the problem. So I tried renaming TMP to TMP_PORT_INFO… and what do you know, the script didn’t get stuck anymore!

I couldn’t find any official documentation about this, but it seems like dotnet build (which dotnet test runs implicitly) depends on the TMP variable to be a path to a temporary storage location for the system. A bit of research made me think that in UNIX, the relevant variable is TMPDIR, but in Windows it’s TMP.

So there you have it. If you want to avoid some painful troubleshooting, just don’t use TMP as a variable name in your scripts.

Tweak WiredTiger cache size if several MongoDB instances run side by side

I have a Linux box running 5 instances of MongoDB, each one for a different environment. The server works fine during the day, most of the time at ~90% memory usage. But recently I started seeing that one (sometimes more) of the mongod instances running there died every night when my backup script ran, courtesy of the OS’s out-of-memory Killer. Thanks to Azure I can see the pattern very clearly:

After noticing that swap wasn’t enabled for the server, enabling it, and seeing that mongod processes kept dying nightly, I discovered that MongoDB does not use swap because it uses memory-mapped files:

Nevertheless, systems running MongoDB do not need swap for routine operation. Database files are memory-mapped and should constitute most of your MongoDB memory use. Therefore, it is unlikely that mongod will ever use any swap space in normal operation. The operating system will release memory from the memory mapped files without needing swap and MongoDB can write data to the data files without needing the swap system.

So enabling swap didn’t solve my problem of dying instances, but it’s something that the server should have anyway so I left it enabled.

I kept reading MongoDB’s official documentation and ran into this:

The default WiredTiger internal cache size value assumes that there is a single mongod instance per machine. If a single machine contains multiple MongoDB instances, then you should decrease the setting to accommodate the other mongod instances.

That sounded pretty promising! I started by looking at my instances to see what the current value was. You can do that by running db.serverStatus().wiredTiger.cache in the Mongo shell, and looking for property “maximum bytes configured” in the output document.

Sure enough, the server has 16GB of RAM, and those ~7.8GB are more or less what I’d expect based on the 0.5 * (RAM-GB - 1GB) calculation in the docs. The issue is that all five instances have the same value!

So off I went and changed that setting to 3GB instead… and voilà! Stable DB server again, even with 5 separate instances of Mongo running in there.

A trip through wake-on-wireless-LAN

For several months now I’ve been struggling with an issue that showed up after I managed to set up Wake on Wireless LAN (WoWLAN) on my desktop computer, and I thought the whole process it would make for a great blog post, so here we go!

Chapter 1: got it to work!

Getting WoWLAN to work wasn’t particularly hard, it basically boiled down to two things:

  • Make sure the BIOS would allow it.
  • Configure the wireless NIC settings in Windows.

The first step was about looking for the appropriate settings in my BIOS, and setting them to the correct values. Some people might not be able to complete this if their motherboard/NIC/BIOS doesn’t support WoWLAN, and in that case there’s not much to be done other than changing hardware (or making sure it’s not just a missing BIOS update, which it probably isn’t). In my case, the only relevant setting (and maybe not even that, since I only use WoWLAN with state S3 (sleep), not S4 (hibernate) nor S5 (soft-off)) was S4/S5 Wake on LAN.

BIOS options

For the second step I went to Device Manager, double-clicked my wireless card under “Network Adapters”, and made sure that Wake on Magic Packet and Wake on Pattern Match were set to Enabled in the Advanced Settings tab; and that “Allow this device to wake up the computer” and “Only allow a magic packet to wake up the computer” were checked in the Power Management tab.

NIC settings

NIC settings - power management

And voilà! I was immediately able to put my computer to sleep, and wake it up with a Wake-on-LAN packet sent through the WiFi.

Chapter 2: an issue shows up

Things were great until I noticed that my computer was waking up on its own every night after I went to bed and put it to sleep.

I first went to Windows’ Event Viewer and found this sequence of events (the first one has the wrong time because Windows still thinks it’s the same moment as when the computer went to sleep, and the second event fixes that by syncing the OS clock with the hardware clock):

Wakeup Event 1

Wakeup Event 2

And a couple of entries later, this one:

Wakeup Event 3

It was clear that the NIC was responsible for waking up the computer, and sure enough, if I disabled its “Allow this device to wake up the computer” setting in Device Manager, the problem went away. But that setting is needed for WoWLAN to work, so I started looking for a solution.

Playing around with the other settings in Device Manager didn’t help. Intel provides some documentation on those that was pretty useful. For obvious reasons, of particular interest were NS offloading for WoWLAN, ARP offloading for WoWLAN, GTK rekeying for WoWLAN, and Sleep on WoWLAN disconnect. The first two let the OS “delegate” some work to the NIC when it is sleeping, so that some things can happen without it waking up. They are enabled by default, and it sounds like that’s the way it should be. The documentation for GTK rekeying for WoWLAN is not clear on what it does, but some additional research shows that it’s related to the PMWiFiRekeyOffload standard keyword for power management, which says “A value that describes whether the device should be enabled to offload group temporal key (GTK) rekeying for wake-on-wireless-LAN (WOL) when the computer enters a sleep state.” So just like the previous two, we want that enabled.

Finally, I just can’t wrap my head around what Sleep on WoWLAN disconnect is. The documentation says “Sleep on WoWLAN Disconnect is the ability to put the device to sleep/drop connection when WoWLAN is disconnected.” but I don’t understand what “WoWLAN is disconnected” means. I think of WoWLAN as an event, not a persistent connection. So I didn’t really mess around with this one. Maybe it’s supposed to say “disabled” instead of “disconnected”, and it lets the NIC go to sleep if WoWLAN is disabled…

I don’t remember what else I did to try and fix this, but if there was anything else, it didn’t work. After a while, I resigned myself and didn’t even try to put my computer to sleep before bed.

Chapter 3: a second attempt

Some time later I came back to the issue and this time my research first led me to the powercfg utility.

powercfg /lastwake didn’t give me any new information, it also said that it was the NIC waking up the computer:

powercfg lastwake

powercfg /waketimers (which needs to run in an elevated command prompt) said there were no active wake timers on my system, so nothing to do there:

powercfg waketimers

Just to be sure, I also went through all the tasks in Task Scheduler, trying to figure out if a scheduled action was the culprit. A couple of them seemed like potential candidates but few of them could wake up the computer, and they were disabled or had schedules that didn’t match the symptoms I was seeing.

Chapter 4: found the root cause!

Fast forward another month or so, and I found a new clue: the wake up from sleep didn’t happen only during the night, the time of day didn’t matter! My computer is usually on all day, so I hadn’t noticed that before. But putting it to sleep at any time during the day resulted in the same wake-up-on-its-own behavior after some time. And more importantly, the computer always woke up on the 41st minute of the hour.

Knowing that, I did some more research and found this question in the Intel forums, with a superbly documented reddit post by someone having the exact same problem.

The author of that post did A LOT of research and troubleshooting, and found out that his issue was related to the Group Key Update feature of WPA2, and concluded that the GTK rekeying for WoWLAN setting in the NIC probably had a bug, since it should have offloaded handling of the appropriate network packets to the NIC, without having to wake up the computer.

I wanted to really soak up all the information there and make sure I understood what was happening, so I followed the research on that post and applied it to my scenario.

My starting point was this document from Microsoft regarding WoWLAN on Windows and which specific things can wake up the computer. Besides receiving a WOL packet or WOL magic pattern, 4 things can do that:

  • AP Association Lost: i.e. the NIC loses its connection to the AP. My AP wasn’t restarting or anything similar, so that couldn’t be it.
  • GTK Handshake Error: (here I had to go and research what “GTK” was. It’s not super relevant to this post, but here I found a great explanation) I’m not sure what could cause an error of this sort, probably something like changing the WiFi pre-shared key on the AP? I wasn’t seeing any errors in my AP/Router’s log, and besides the wake-up issue, my WiFi worked fine, so I guessed it was probably not this.
  • 802.1x EAP-Request/Identity Packet Received: this only applies to WPA2-Enterprise, and since I’m using WPA2-Personal, it couldn’t be it.
  • Four-way Handshake Request Received: thanks to all the reading I had done up to this point I knew that 4-way handshake is the process by which the AP and a wireless client establish keys (PTK and GTK) to encrypt the packets sent between them, and that my AP was configured to update the GTK every hour. And my computer was restarting every hour. So… We probably have a winner!

I confirmed that this is probably the culprit by changing the GTK rekeying interval (referred to in my settings as “Group Key Update”) in my router. After that, the minute when my computer woke up changed to match the time of the AP restart, so I’m pretty confident that this is it.

Chapter 5: …but it still doesn’t work

Yet, just like for that other person having this issue, having GTK rekeying for WoWLAN enabled wasn’t helping, so I’m inclined to agree that there’s a bug somewhere in Windows or the NIC driver.

Speaking of which… I looked for updates to my NIC driver, and there was one but it didn’t help things.

A workaround for those that can do this, is to increase the GTK rekey interval in the router. I was going to set it to 12 hours (at 9am/pm) so it didn’t happen while I was asleep, but my router only allows up to 2 hours.

Conclusion

So I’m still leaving my computer on when I go to bed because I know it will wake up on its own not long after. I’ll keep my eye out for updates to the NIC driver and see if they help.

In any case, I got a lot out of this ordeal. I learned about low-level details of WiFi connections like the Beacon Frame, the Beacon Interval and DTIM, plus some other things mentioned above. So even if the problem hasn’t gone away, trying to solve it has been a very productive endeavor.

Optimizing PIA OpenVPN speed on Advanced Tomato

A while back I noticed that my ISP was throttling my speeds for most things, and that using a VPN worked around that throttling. I use Private Internet Access (aka PIA) as my VPN provider (I’d recommend them any time, if you sign up here we’ll both get 1 month free!), and I confirmed this with their desktop application running on my computer, but I wanted a way to centralize the VPN connection so I didn’t have to start one form each device in my home network.

Luckily I use open-source firmware Advanced Tomato on my Asus R7000 router, and it can run up to two simultaneous OpenVPN clients. PIA can be set up in a bunch of ways one of which is with an OpenVPN client, so it was perfect! They even have a guide on how to set it up in Advanced Tomato.

So I got everything working without much hassle… but my Internet speed was way worse than when I used the PIA desktop application. With the app I got my “line speed” of ~60 Mbps (what I expect to get from my ISP), but with OpenVPN on the router I got an average of 12 Mbps (I’ll only talk about download speeds, since my upload isn’t particularly fast anyway). Some research led me to decide that the router’s processor was the bottleneck, particularly due to the need to encrypt/decrypt traffic from the VPN tunnel. It’s a dual-core 1GHz ARM chip which apparently does not have native hardware instructions for cryptography, so it needs to do it with software and is thus limited by CPU speed. Some newer routers with newer chips are apparently getting hardware-accelerated cryptography. Keep that in mind when buying a router if you have a setup like mine.

I tried tweaking some settings in the router’s GUI but couldn’t get any real improvement, so I resigned myself to lower speeds when I wanted to have the VPN on in the router.

Today I decided to come back to the topic and see if I could improve the situation, and found two things that made a noticeable difference:

  • Overclocking the router
  • Adding the fast-io, sndbuf and rcvbuf settings to my OpenVPN configuration:
    openvpn custom settings

I’ve never been one for overclocking my hardware, but I read several posts about people doing it without problems so I went ahead and bumped my router’s clock speed from 1 to 1.4 GHz, and just with that, my Internet speed jumped from 12 to 18 Mbps. Not back-breaking, but a very appreciated 50% improvement!

But the real game changer were the OpenVPN settings, which took me from 18 to 30-35 Mbps! The OpenVPN documentation has great explanations for all possible options if you’re interested in the details. In short, fast-io can help non-Windows systems by optimizing certain code paths, while sndbuf and rcvbuf control the send/receive buffer sizes for the UDP or TCP socket.

Now, note that the specific number for sndbuf and rcvbuf will probably vary for each person/situation. The ideal value will depends on the latency to your VPN server, the reliability of the connection, and maybe other things. Regrettably, I don’t have a formula for you, so I’d suggest starting with a value of 524288 and then moving from there. In my case, 786432 was an improvement but going all the way to 1048576 gave me lower speeds. YMMV.

Fixing error code 137 when building a Docker image

A few days ago I was containerizing an Angular web application and ran into an issue that I think is worth documenting for future reference.

Implementing the application itself went without a hitch, and everything looked good when hitting F5 in Visual Studio. But When I ran docker build, I got the following error from the step that ran dotnet publish:

> client-app@0.0.0 build /src/MyApp/ClientApp
> ng build "--prod"

Killed
npm ERR! code ELIFECYCLE
npm ERR! errno 137
npm ERR! client-app@0.0.0 build: `ng build "--prod"`
npm ERR! Exit status 137
npm ERR!
npm ERR! Failed at the client-app@0.0.0 build script.
npm ERR! This is probably not a problem with npm. There is likely additional logging output above.

npm ERR! A complete log of this run can be found in:
npm ERR! /root/.npm/_logs/2018-11-03T09_21_34_260Z-debug.log

The first thing to know is that the Dockerfile was building and publishing the application in Release mode, not Debug mode (which I had been using to run it in Visual Studio). So first things first, I tried to publish it in Release mode on its own (not by building the Dockerfile) with dotnet publish -c Release MyApp.csproj… and that worked fine. So the issue had to do with the fact that the app was being built/published inside a container.

With a bit of googling I found out that error 137 usually means that the process was killed by the Linux kernel when the system is running out of memory.

So I looked at my Docker configuration (right-click the docker icon in the system tray, go to Settings, then Advanced) and saw that the Linux VM was configured with only 2GB of RAM. I’m surprised that isn’t enough, but I bumped it to 4GB to see if it made any difference… and it did! docker build now ran successfully!

At some point I’ll figure out why my application requires so much RAM to build… but at least now I’m able to create the docker image successfully.

Improving the throughput of NLog.Targets.Syslog when using UDP

I’m using Luigi Berrettini’s NLog.Targets.Syslog package in one of my projects to log from a set of containers to a centralized syslog server, and I noticed that when one of the containers in my application had a sudden spike of logged messages, they were taking a very long time to reach the syslog server.

A bit of research brought me to this closed issue in the project’s repo, and this question that the author posed to Microsoft in relation to the issue. I think the first link explains the problem pretty well but long story short, it turns out that if you configure the NLog target using the UDP protocol, default settings in the library make it so messages get dequeued to be sent through the UDP socket at a rate of 2 per second. The rationale behind the code that has this effect was to try to minimize message loss if the UDP destination wasn’t there, but IMO the performance impact is a bad trade-off. And since the nature of UDP means that package loss is a possibility, I’d rather know that some of my messages might get lost, but have better logging throughput out of the box.

The fix to improve this throughput is pretty easy, just add a connectionCheckTimeout attribute to the target/messageSend/udp element in the nlog.config file, with a low value (0 being a possibility).

<target xsi:type="Syslog" name="syslogTarget">
  <sl:layout xsi:type="SimpleLayout" text="${message}" />
  <sl:messageSend>
    <sl:udp server="127.0.0.1" port="514" connectionCheckTimeout="0" />
  </sl:messageSend>
</target>

This value (in microseconds) controls the timeout that the target uses when trying to decide if data can be sent on the socket, a check it does for every message. So decide if you want anything other than 0 here, update your nlog.config, and enjoy your improved throughput!

What are all the sections in the Dockerfile generated by Visual Studio?

If you’ve added Docker support to a project through Visual Studio you know that a Dockerfile is automatically created for you. Some things in this file are not very intuitive and took me a while to figure out, so I decided to document my findings and share them with the community. This is all based on my research and understanding, so if anyone knows better feel free to chime in. Also, I assume you have a basic understanding of what the commands in a Dockerfile do, the main purpose of this post is to explain the whys.

I’ll start by creating a .NET Core Console app called DockerConsoleApp and adding Docker support by right clicking on the project in Solution Explorer and selecting Add -> Docker Support (choose Linux or Windows depending on the kind of containers that your Docker daemon is configured to use).

AddDockerSupport.png

How to add Docker Support to your project

Your solution should now have a docker-compose project, and your console app should now have a Dockerfile that looks like this (at least as of the time of writing; I’ve seen it change a couple of times in the past couple of months):

FROM microsoft/dotnet:2.0-runtime AS base
WORKDIR /app

FROM microsoft/dotnet:2.0-sdk AS build
WORKDIR /src
COPY DockerConsoleApp.sln ./
COPY DockerConsoleApp/DockerConsoleApp.csproj DockerConsoleApp/
RUN dotnet restore -nowarn:msb3202,nu1503
COPY . .
WORKDIR /src/DockerConsoleApp
RUN dotnet build -c Release -o /app

FROM build AS publish
RUN dotnet publish -c Release -o /app

FROM base AS final
WORKDIR /app
COPY --from=publish /app .
ENTRYPOINT ["dotnet", "DockerConsoleApp.dll"]

Obviously, the directory and file names (DockerConsoleApp in the example above) will depend on the name of your project.

Let’s split the analysis into the four stages defined in this file (base, build, publish and final) but I’ll tackle them from most-to-least obvious or complicated. So let’s start with the publish stage.

Publish stage

FROM build AS publish
RUN dotnet publish -c Release -o /app

The first line indicates that this stage depends on the build one, but that doesn’t prevent us from easily explaining what happens here. The one thing that’s worth noting is that the build stage has a copy of our application’s source code, and so RUNning dotnet publish in this stage does exactly what it sounds like: it builds our code (using the Release configuration specified with the -c parameter) and publishes the output to the /app directory in the image (specified with the -o parameter). Not much else to say here, so let’s move on.

Final stage

FROM base AS final
WORKDIR /app
COPY --from=publish /app .
ENTRYPOINT ["dotnet", "DockerConsoleApp.dll"]

This is the easiest stage to figure out. First off, it is based on the base stage, which in fact does nothing. “Why does it exist, then?” you might ask? We’ll get to that. What matters now is that the base stage depends on the official microsoft/dotnet:2.0-runtime docker image from Microsoft, which as its name implies contains the runtime bits to run (but not build) .NET Core applications (in particular console applications, ASP.NET Core applications are a slightly different story). This stage produces the final image that we’d publish to a repository so we want it to be as small as possible, making the 2.0-runtime image the best fit.

Lines 2 to 4 just move to a particular directory in the Docker image, copy the output of the publish stage (which is all that we need to run our app), and define the command to be executed when starting a container based on this image.

Build stage

FROM microsoft/dotnet:2.0-sdk AS build
WORKDIR /src
COPY DockerConsoleApp.sln ./
COPY DockerConsoleApp/DockerConsoleApp.csproj DockerConsoleApp/
RUN dotnet restore -nowarn:msb3202,nu1503
COPY . .
WORKDIR /src/DockerConsoleApp
RUN dotnet build -c Release -o /app

This is the most interesting stage in terms of the lessons it teaches. For starters we see that this stage is based on the microsoft/dotnet:2.0-sdk image in contrast to the microsoft/dotnet:2.0-runtime image used by the final stage above. The SDK image is signifcantly bigger (1.74GB VS 219MB) because it has everything required to build our code. The size comparison should make it clear why we want our final image to be based on the 2.0-runtime image and not the 2.0-sdk one.

The actual work done in this stage starts with copying the .sln and the .csproj files to the image. In this case it’s only one .csproj, but if your project depends on other projects in the solution, you’d see one COPY line per .csproj file1. Then we run dotnet restore2, and finally copy all of the source code (which I should note, overwrites the .sln and .csproj files that were copied earlier) before running dotnet build to compile our application.

So, if the last COPY takes care of the .sln and .csproj files, why are we “cherry-picking” them into the image by hand?

The answer is Docker’s build cache. Docker generates a layer each time it runs any command from a Dockerfile, and tries to reuse them as much as possible. Before running any command, it checks if it has run it before with the same current state (i.e. from the same current layer) and if it believes that running it again would result in the exact same result, then it just grabs that resulting layer from its cache; otherwise it executes the command and foregoes using the cache for any additional commands for the rest of that build. For ADD and COPY commands it uses a hash of the contents of the files to determine if it can use the cache, while for all other commands (like RUN) it just looks at the command string itself.

It should be clear that we want to leverage this cache as much as possible so building our Docker image is fast. One key insight towards this goal is that source code files change pretty much all the time, but not all steps of building our application actually need them. Another way of thinking about this is: when you bring your source code files into the image, you’re pretty much guaranteeing that Docker can’t henceforth use its layer cache, so before you do that you should try to perform as many build steps as possible in the hopes that at least those will be able to leverage the layer cache. The more “static” (deterministic) those build steps, the better their chances of actually being able to use the cache.

dotnet restore is a perfect candidate for this because it only depends on the .csproj files, which for the most part change infrequently (especially when compared to source code files). For a particular set of .csproj files, running dotnet restore always results in the same NuGet packages being downloaded. Package versions are explicitly specified so there’s no risk of asking for a package by name and ending up with a newer version if the package owner published an update. Docker itself cannot know for sure that this command is deterministic, but we do and can use this knowledge to invoke that step in a way that it can leverage the cache.

The .sln file is not technically necessary for dotnet restore, but it lets us execute the command once instead of doing it once per project file.

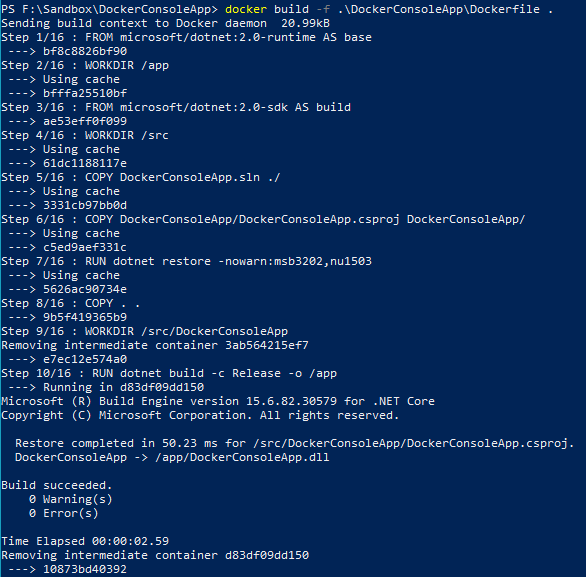
If you build the Dockerfile manually with docker build, you can actually see layer caching at play. The first time it builds, Docker will say that it’s doing work for each and every step. If you then build it again with no changes to project files nor source code, you’ll see that every step says “Using cache” (as the first image below shows). If you then change Program.cs in any way (say, adding a Console.ReadLine();), you’ll see that all steps up to the dotnet restore keep using the cache, and only subsequent commands need to be executed (as the second image below shows).

EverythingFromCache.PNG

Logs from Docker build once the project has been built before.

AfterSourceCodeChange.PNG

Logs from Docker build after making changes to Program.cs

So the build stage is split like that in order to maximize usage of Docker’s layer cache, and consequently minimize the time it takes to build the image. This means that Docker will only need to download your NuGet dependencies once3 instead of on every build.

Base stage

FROM microsoft/dotnet:2.0-runtime AS base
WORKDIR /app

Finally, we come to the base stage. I said above that it does nothing, which is basically accurate (WORKDIR does create the directory, but nothing is being copied to it). The reason why Visual Studio includes this stage in the Dockerfile it generates, is so it can work its magic to let you debug your code inside a running container. If you debug the docker-compose project, you’ll see something like these two messages in the Output window (replace with your directory and project names as necessary):

docker build -f "F:\Sandbox\DockerConsoleApp\DockerConsoleApp\Dockerfile" --target "base" -t "dockerconsoleapp:dev" "F:\Sandbox\DockerConsoleApp"
docker-compose -f "F:\Sandbox\DockerConsoleApp\docker-compose.yml" -f "F:\Sandbox\DockerConsoleApp\docker-compose.override.yml" -f "F:\Sandbox\DockerConsoleApp\obj\Docker\docker-compose.vs.debug.g.yml" -p dockercompose8626016377156038970 --no-ansi up -d --no-build --force-recreate --remove-orphans

The docker build command uses the --target parameter to indicate that Docker should stop processing the Dockerfile once it completes the steps in the base stage (and use that image as the result of the build). Since it is the first stage in the file, it’s the only one that gets built when VS is doing its magic. Visual Studio leaves this image empty because when it uses it to start a container, it will mount the directory in the host where your code lives, into the /app directory in the container. You can see how it does that by looking at the docker-compose.vs.debug.g.yml file referenced in the docker-compose command, which includes some other volumes in addition to the one that loads the source code:

volumes:
- F:\Sandbox\DockerConsoleApp\DockerConsoleApp:/app
- C:\Users\alexv\vsdbg\vs2017u5:/remote_debugger:ro
- C:\Users\alexv\.nuget\packages\:/root/.nuget/packages:ro
- C:\Program Files\dotnet\sdk\NuGetFallbackFolder:/root/.nuget/fallbackpackages:ro

Without the base stage in the Dockerfile, Visual Studio would not have an empty image to start an empty container where it could mount your source code, and would probably not be able to provide a live debugging experience when running your code inside an actual container.

Conclusion

Hopefully now you have a better understanding of why the Dockerfile generated by Visual Studio looks like it does, which should let you decide where you can safely make changes to it if you need to, while keeping it cache-friendly.


  1. If the dependencies between projects were already there when you added Docker support to your project. If you added dependencies afterwards, it’s in your best interest to add the corresponding COPY commands here (in fact building the Docker image might fail if you don’t). 
  2. The -nowarn:msb3202,nu1503 parameters are workarounds for a couple of open issues that have to do with Visual Studio’s support for Docker and a change of behavior in NuGet that turned a warning (which didn’t cause dotnet build to fail) into an error (which does). 
  3. Technically, once every time you make changes to your .csproj or .sln files. 

Visual Studio, Docker Cloud hooks, and UTF-8 with signature

Today I ran into an issue trying to make custom hooks in Docker Cloud work. I first tried the default post-push hook to add another tag to the built image, straight from the documentation:

#!/bin/bash
docker tag $IMAGE_NAME $DOCKER_REPO:$SOURCE_COMMIT
docker push $DOCKER_REPO:$SOURCE_COMMIT

But the logs in Docker Cloud had the following error: Could not execute hook at 'hooks/post_push'. Is it missing a #! line?

Error in Docker Cloud build log

It was not missing that line, and I got the same error whether I used Windows or Unix end-of-line characters.

After a while I remembered an issue I’ve had with Visual Studio at other times which is that it will save files with encoding “UTF-8 with signature”. The “with signature” part is why sometimes other consumers of the file (in this case Docker Cloud) cannot read it correctly.

What “UTF-8 with signature” does is add an invisible sequence of bytes called a BOM (Byte Order Mark) to the beginning of the file.

However, let’s look at this answer in Stack Overflow:

The UTF-8 BOM is a sequence of bytes (EF BB BF) that allows the reader to identify a file as being encoded in UTF-8.

Normally, the BOM is used to signal the endianness of an encoding, but since endianness is irrelevant to UTF-8, the BOM is unnecessary.

According to the Unicode standard, the BOM for UTF-8 files is not recommended:

Even if it was recommended, I was almost certain that the BOM was the culprit of my issue. I needed the file to be saved as “UTF-8 without signature” (without that invisible sequence of bytes at the beginning of the file). The way to do that is to open your file in Visual Studio and go to File -> Save As. When the dialog comes up, first make sure Visual Studio didn’t add .* to the end of your filename (it probably does this for files that have no extension), otherwise nothing will happen when you try the next step. Now click on the arrow on the right side of the “Save” button, select “Save with Encoding…” (if you didn’t remove .* from the end of your filename, nothing will happen here) and set the Encoding option to “Unicode (UTF-8 without signature) – Codepage 65001”.

How to save a file as UTF-8 without signature – Step 1

How to save a file as UTF-8 without signature – Step 2

Save your file, and retry whatever it is you were doing, it should work this time. At least the Docker Cloud build did :).